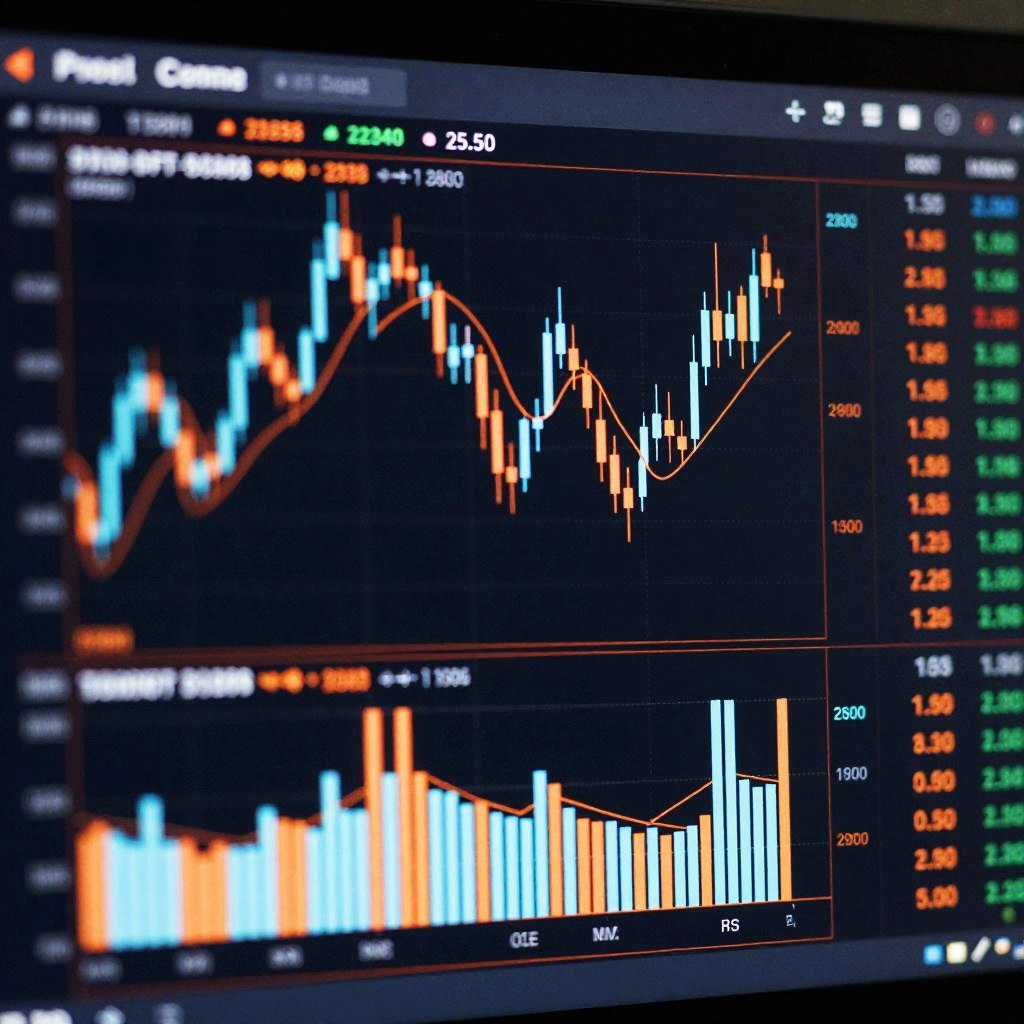
Close-up photograph of a colorful financial trading screen displaying multiple price charts with orange, blue, and white bars, and real-time data in green and orange
Prompt:
Bitcoin screenshot of a trading platform displaying fluctuating cryptocurrency charts, candlestick patterns, live price updates, dark mode with neon blue and orange highlights, complex data overlays, cutting-edge financial technology vibe
Model:
"Use prompt" will open Create Image tool and will load the prompt
"Remix" will open Create Image tool with this photo set as Reference
Image description:
This photograph depicts a close-up of a computer screen displaying a financial trading chart. The chart features two colorful line graphs with orange and blue bars representing stock prices over time. The upper graph shows a rising trend with a peak, while the lower graph displays a more stable, flat line. The graph's vertical axis shows price values ranging from 1950 to 2050, and the horizontal axis represents time. The background is black with white and red text labels, including "Crude Oil" and "USD." The right side of the screen displays a green and orange price ticker, with numbers indicating buy and sell orders. The screen is illuminated, highlighting the vivid colors and sharp contrasts.
Related keywords:
Image license:
Royalte-free