Screenshot of the Uizard Plays app interface displaying charted data on temperature, humidity, and brightness with blue and white colors.
Prompt:
Uizard dashboard interface, professional data visualization, charts and graphs with smooth animations, dark mode theme, neon accents blending with deep blue gradient background, tech-focused environment, innovative UX design concept
Model:
"Use prompt" will open Create Image tool and will load the prompt
"Remix" will open Create Image tool with this photo set as Reference
Image description:
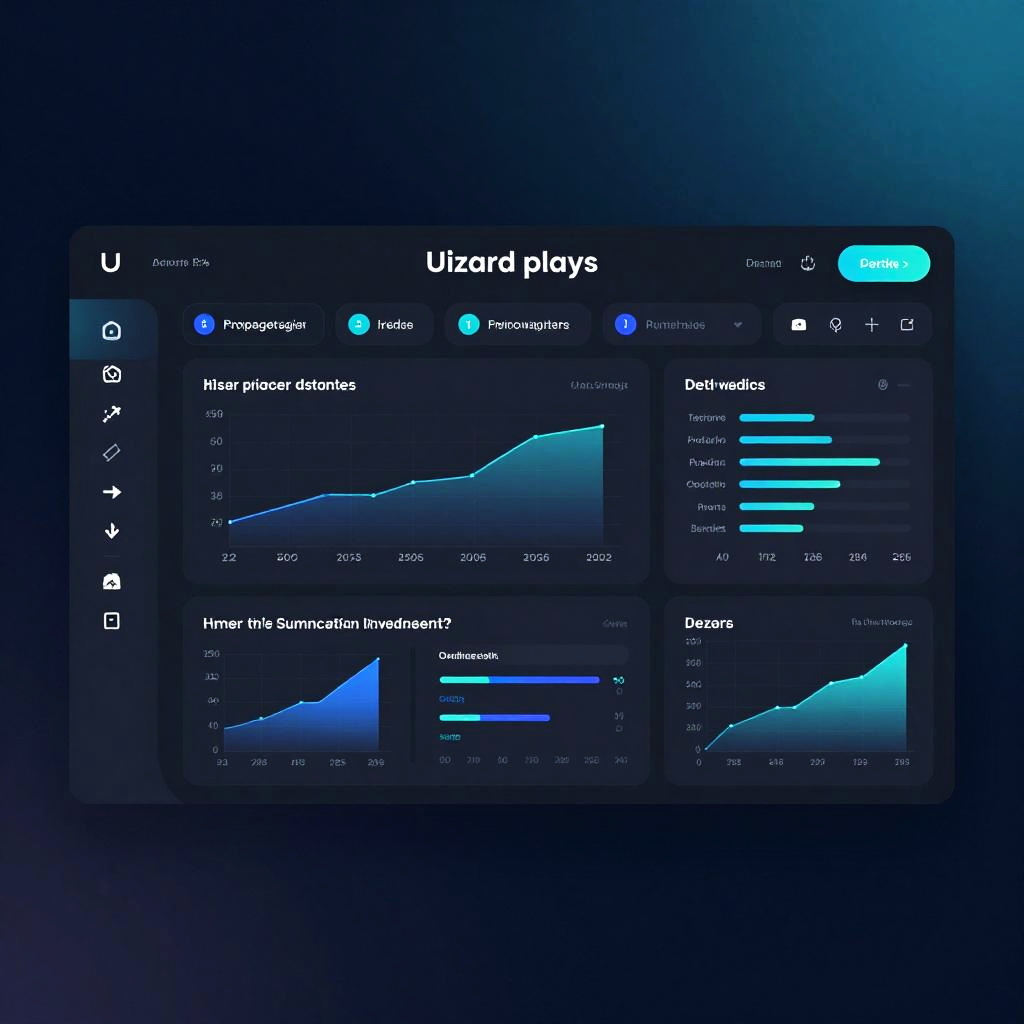
This is a photograph of a digital interface for the "Uizard plays" app. The screen has a dark blue gradient background with a glowing blue highlight in the top right corner. The interface features a menu on the left with icons for "Home screen", "Live", "Simulator", "Favorites", and "Settings". The main section displays two charts: one for "Heat graph indicators" and another for "Under the Simulation Model?" Both charts have blue and white gradients, with data points and lines indicating various metrics. The app's name "Uizard plays" is centered at the top. The overall design is modern and sleek, with a focus on data visualization and user interaction.
Related keywords:
Image license:
Royalte-free