Pixu.ai
Creator Studio
Login / Signup
  • Home Home
  • Pricing plans Pricing plans
  • Prompts gallery T Prompts
  • People images gallery People images
  • People illustrations gallery People illustrations
  • Articles Articles
  • API API
  • About us About us
  • Login / Signup
  • Contact us:
×

Colorful K-Line Chart Visualization

Prompt:

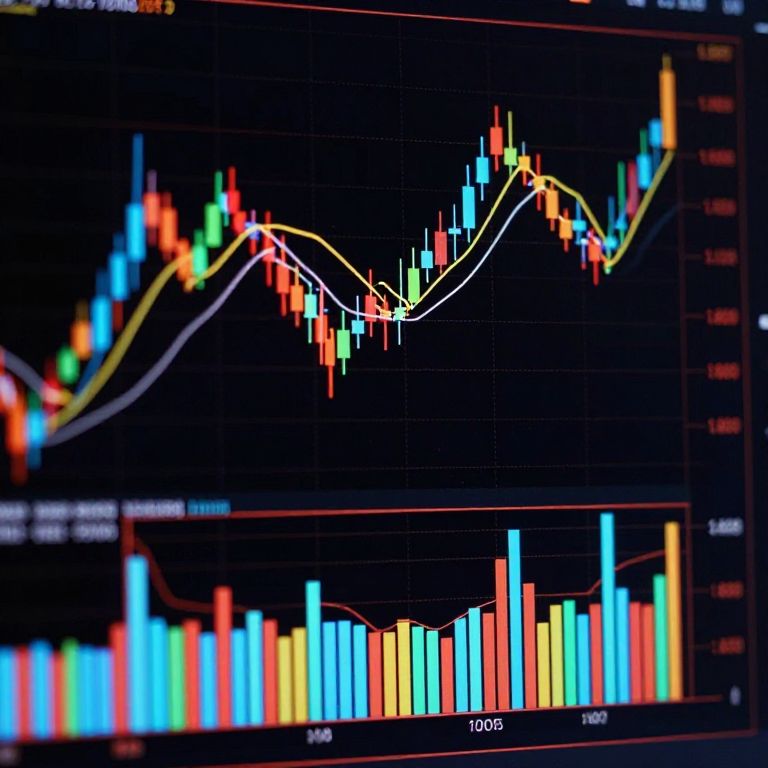
K-line chart visualization featuring colorful candlestick indicators against a deep black background, with glowing trade volume bars beneath and animated lines showing upward and downward trends, evoking a cutting-edge financial trading platform atmosphere.

Model:

Zit

"Use prompt" will open Create Image tool and will load the prompt

"Remix" will open Create Image tool with this photo set as Reference

Related keywords:

animated trends
black background
blue bars
business analysis
candlestick indicators
colorful bars
data visualization
digital display
digital screen
economic analysis
economic trends
financial dashboard
financial data
financial indicators
financial monitoring
financial software
financial technology
financial trading
graph lines
green bars
high contrast
investment
k-line chart
line chart
market fluctuations
market movement
market peaks
market trends
market valleys
red bars
stock analysis
stock exchange
stock market
stock market graph
stock prices
technology
trade volume
trading platform
yellow bars
See all 35 tags

Image license:

Royalte-free

Similar prompts

❮ ❯