Digital screenshot of Alprismo's AI Prompts software interface, displaying colorful charts, graphs, and data metrics with a dark blue background.
Prompt:
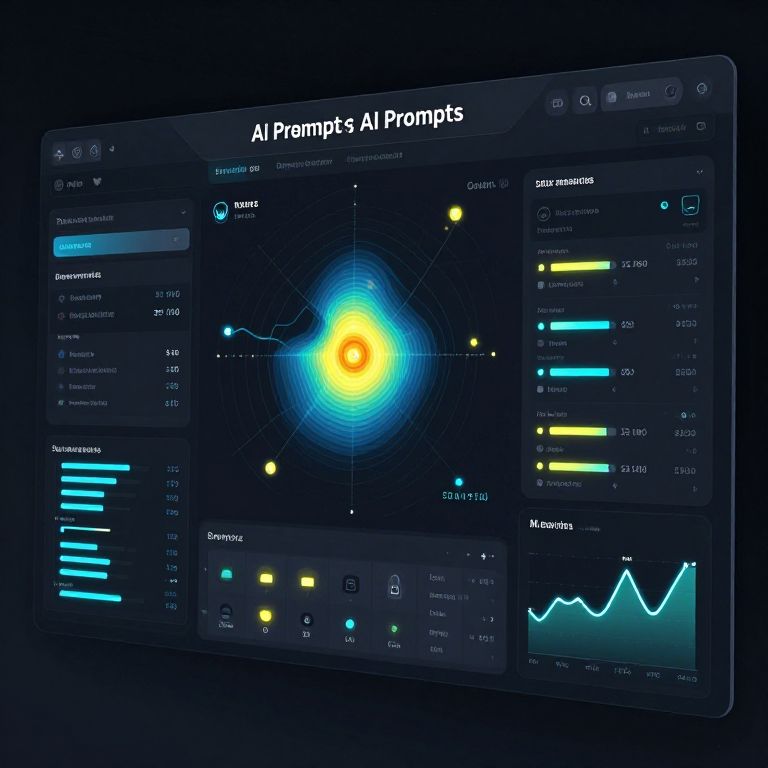
AI prompts hot: A sleek, modern digital dashboard displaying trending AI prompts in real-time, with heat maps showing user engagement, glowing indicators, and animated trends. Futuristic UI design with a dark theme and glowing interactive elements.
Model:
"Use prompt" will open Create Image tool and will load the prompt
"Remix" will open Create Image tool with this photo set as Reference
Image description:
This is a digital image of a tablet displaying an advanced financial trading platform interface. The screen is dark blue with white and bright blue text, and various colorful graphs and charts. Central to the image is a bright yellow and blue circular chart with concentric rings and a white line graph overlay. On the left, there are multiple blue and yellow horizontal bars representing trades. On the right, there are lists of trades with yellow and blue bars indicating prices. At the bottom right, a blue line graph shows price fluctuations over time. The top of the screen reads "AlPrimos Al Platforms" in white text. The background is pitch black, emphasizing the tablet screen's vivid colors.
Related keywords:
Image license:
Royalte-free