Color-coded network diagram with interconnected nodes and lines in green, yellow, red, and blue, labeling various locations and connections.
Prompt:
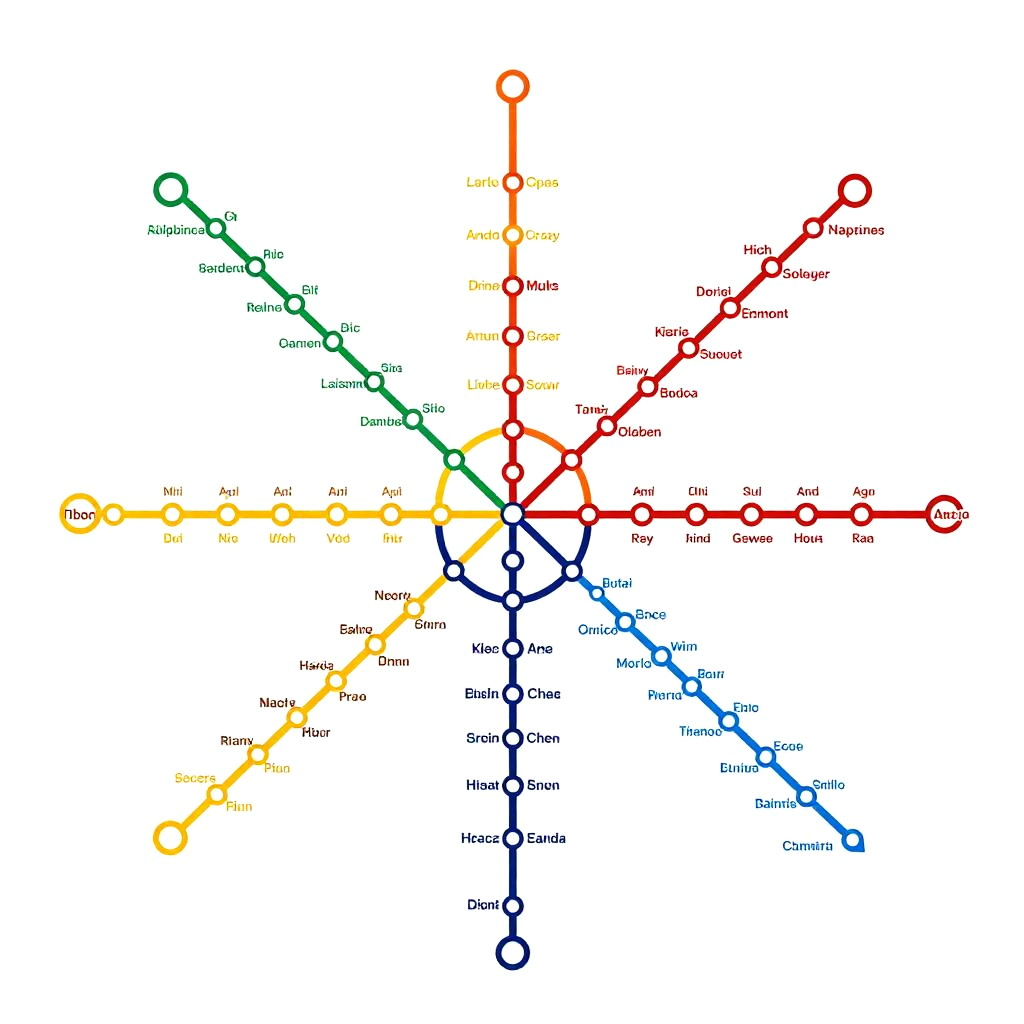
Detailed visualization of an urban subway map surrounded by intricate, interconnected network threads illustrating the network effect, depicted in minimalist infographic style, using a primary colors on white background palette on a clean minimalistic background
Model:
"Use prompt" will open Create Image tool and will load the prompt
"Remix" will open Create Image tool with this photo set as Reference
Image description:
This is a digital, colorful graph showing a network of interconnected nodes and lines. Each node represents a location, labeled in black text, such as "Hillsboro," "Tigard," "Beaverton," and "Portland." Lines connecting the nodes are colored in red, green, blue, yellow, and orange, indicating different types of connections or paths. The layout is a complex web, with some nodes having multiple connections. The background is plain white, making the colorful lines and text stand out. The graph is highly detailed, with small circles representing nodes and lines of varying thickness.
Related keywords:
Image license:
Royalte-free